 Clwyd Probert
The Marketing Co-Pilot Operating Model: Scan, Co-Pilot, Scale
The Marketing Co-Pilot Operating Model is a three-stage framework for running AI-assisted marketing: Scan (research, listening and persona intake),...

Key Takeaway
Building a B2B martech stack that works means starting with an architecture decision, not a tool decision. The average B2B team runs 12-15 tools yet wastes 8+ hours weekly reconciling data between them. A hub-and-spoke architecture — one core platform connected to specialist tools via native integrations or iPaaS — delivers 30-40% cumulative savings while avoiding the 35-40% integration failure rate that plagues unplanned stacks. Audit first, architect second, select tools third.
Building a martech stack that actually works requires a systematic framework: audit your current tools, choose the right architecture pattern, select a core platform, add point solutions strategically, integrate reliably, govern proactively, and measure outcomes. Marketing Mary's stack unification platform helps B2B teams at every stage — connecting your existing 12+ tools into a single operational layer so you stop losing hours to manual reconciliation and start making decisions from unified data.
Most B2B marketing teams approach their technology stack backwards. They buy tools first and try to connect them later, ending up with a fragmented collection that creates more work than it eliminates. The companies that build stacks that genuinely work do the opposite: they define the architecture first, select the core platform second, and add point solutions only when a specific, measurable gap justifies the integration complexity. This guide walks you through exactly that process, step by step.
A martech stack that works delivers three outcomes: integration coherence (data flows automatically between tools without manual intervention), lead routing reliability (every lead reaches the right person at the right time with the right context), and unified data (one source of truth for every metric, contact record, and campaign outcome). If your stack does not achieve all three, it is costing you more than it saves.
The gap between aspiration and reality is significant. Most mid-market B2B organisations allocate £50,000-£150,000 annually to marketing technology, yet 30-40% of that spending is redundant or underutilised. The root cause is not poor tool selection — it is the absence of a deliberate architecture that defines how tools connect, how data flows, and who owns what. Without architecture, every new tool purchase creates exponential integration complexity rather than linear capability improvement.
Integration failure is the most common and most expensive outcome. Research consistently shows that 35-40% of integrations in poorly planned stacks fail — meaning data does not sync, workflows break, and teams revert to manual processes that the technology was supposed to eliminate. The financial impact extends beyond wasted licence fees: 60-70% of organisations report significant time waste from unintegrated tools, with marketing operations teams losing 8-12 hours weekly to manual data reconciliation between disconnected platforms.
12-15
Average Tools per Stack
B2B mid-market average
8+ hrs/wk
Lost to Reconciliation
Manual data transfers
35-40%
Integration Failure Rate
In poorly planned stacks

Auditing your current stack before adding or replacing anything is the single most valuable step in the build process. A thorough audit reveals redundant tools, underutilised features, integration gaps, and hidden costs that change your architecture decisions entirely. Skip this step and you risk building on a foundation of assumptions rather than evidence.
For a comprehensive audit methodology including scoring matrices and TCO calculators, see our pillar guide: What Is a MarTech Stack? The Complete Audit & Consolidation Framework.
Step 1: Inventory every tool. List every marketing technology platform your team uses — including the unofficial ones that individuals adopted without central approval. For each tool, record the annual cost, number of active users, primary use case, and the data it generates or consumes. Most teams discover 20-30% more tools than they thought they had when shadow IT is included.
Step 2: Score utilisation. For each tool, assess feature utilisation on a 1-5 scale. A tool scoring 2/5 means your team uses 40% or less of its capabilities. If you are paying enterprise pricing for a tool your team uses at starter-tier level, that is an immediate optimisation opportunity. Industry research suggests 30-40% of martech spending falls into this category.
Step 3: Map data flows. Document how data moves between tools. For every integration, note whether it is native (built by the vendor), iPaaS-mediated (via Zapier, Make, or Workato), or manual (CSV exports, copy-paste). Manual data flows are where your 8+ hours of weekly reconciliation time lives — and where integration investment delivers the fastest return.
Step 4: Calculate true cost. Licence fees are typically 55-65% of total martech expenditure. Add implementation services (20-30%), ongoing maintenance, integration development, and the staff time required to manage each tool. A mid-market organisation paying £80,000 in visible licence fees likely spends £130,000-£150,000 when all costs are included.
Step 5: Identify consolidation candidates. Tools with overlapping capabilities, low utilisation scores, and manual data flows are prime candidates for replacement or elimination. Most audits reveal 3-5 tools that can be consolidated into existing platform features — saving both licence costs and integration maintenance.
Key Takeaway
The audit is not a one-off exercise. The companies with the most effective stacks run quarterly mini-audits (utilisation check, cost review) and annual deep audits (full architecture review). Formal governance reduces tool sprawl by 45-50% over two years compared to ad hoc management.
The architecture pattern you choose determines your stack's ceiling — it sets the maximum integration coherence, data quality, and scalability you can achieve regardless of which specific tools you select. For B2B teams with 100-500 employees, three patterns dominate: suite-based, best-of-breed, and hub-and-spoke. Each makes different trade-offs between specialisation, integration simplicity, and total cost of ownership.
The suite-based approach means buying most of your marketing capabilities from a single vendor — HubSpot Marketing Hub Enterprise, Salesforce Marketing Cloud, or Adobe Experience Cloud. Integration is native and reliable because everything runs on the same database. The trade-off is depth: suite modules rarely match the capability of best-in-class point solutions in any single category. For teams that value operational simplicity over feature depth, suites are compelling.
The best-of-breed approach means selecting the optimal tool in every category — the best email platform, the best analytics tool, the best ABM solution — and integrating them together. This delivers maximum capability in each functional area but creates significant integration complexity. Every tool-to-tool connection must be built, maintained, and monitored. For teams with 12-15+ tools, the integration overhead can exceed the productivity gains from superior features.
The hub-and-spoke approach combines the strengths of both. You select one core platform (the hub) that handles your primary workflows — CRM, marketing automation, content management, and basic analytics — then connect specialist tools (the spokes) via native integrations or an iPaaS layer. This pattern is the recommended architecture for B2B teams with 100-500 employees because it balances capability depth with manageable integration complexity.
| Pattern | Integration Complexity | Feature Depth | Typical Cost (Mid-Market) | Best For |
|---|---|---|---|---|
| Suite-Based | Low — native connections | Moderate — broad not deep | £60K-£120K/yr | Teams valuing simplicity over specialisation |
| Best-of-Breed | High — every tool connected | Maximum — specialist tools | £80K-£200K+/yr | Enterprise teams with dedicated ops staff |
| Hub-and-Spoke | Moderate — controlled spokes | High — core + specialists | £50K-£150K/yr | B2B mid-market (100-500 employees) |
Sources: Chiefmartec MarTech Landscape 2024, research compilation from industry benchmarks
The hub-and-spoke model works because it constrains integration complexity to a manageable number of connections. Instead of every tool needing to talk to every other tool (which creates exponential integration points), each spoke only connects to the hub. A 10-tool stack under hub-and-spoke requires 9 integrations; the same 10 tools under best-of-breed might require 45. That difference translates directly into maintenance hours, failure points, and operational overhead.

Your core platform selection is the most consequential technology decision in the entire stack build. The platform you choose becomes the gravitational centre of your marketing operations — every other tool, workflow, and data flow connects through it. Changing your core platform later is a 3-6 month migration project costing £50,000-£150,000 in direct expenses plus significant productivity loss. Get this decision right first time.
Evaluate core platforms against six criteria weighted by their impact on long-term operational success:
Native integration ecosystem. How many of your required spoke tools connect natively (without custom development or iPaaS)? HubSpot's App Marketplace lists 1,500+ integrations; Salesforce's AppExchange exceeds 3,000. Native integrations are 3-5x more reliable than custom-built connections and cost nothing to maintain.
Data model flexibility. Can the platform accommodate your specific B2B data requirements — custom objects, association types, multi-touch attribution models, and account-based data structures? Rigid data models force workarounds that compound into technical debt over 2-3 years.
UK and GDPR compliance. 73% of UK marketing operations managers cite GDPR as their primary vendor evaluation factor. Evaluate data residency options (EU-hosted instances), consent management capabilities, data subject access request workflows, and the vendor's track record with ICO compliance. Post-Brexit data transfer considerations add another layer — ensure your platform supports UK-EU data adequacy requirements.
Implementation timeline and cost. HubSpot implementation typically takes 8-12 weeks at £500-£2,000 per month in professional services. Salesforce implementation runs 12-20 weeks at £1,000-£5,000+ per month. Budget 20-30% of implementation effort for team training — underinvesting here is the most common cause of poor adoption and the subsequent tool underutilisation that audits later reveal.
Total cost of ownership. Platform costs represent 55-65% of total martech expenditure. Calculate the 3-year TCO including licence escalation (most platforms increase pricing 10-20% at renewal), required add-ons, API call limits, and the headcount needed to administer the platform. A platform that is £20,000/year cheaper on licence fees but requires an additional half-FTE to manage is not actually cheaper.
AI and automation capabilities. Evaluate the platform's native AI features for content generation, lead scoring, workflow automation, and predictive analytics. Platforms with strong native AI reduce your need for separate AI point solutions — and Marketing Mary's AI marketing agent integrates directly with major platforms to extend their capabilities further.
Ready to Unify Your Marketing Stack?
See how Marketing Mary's stack unification eliminates 8+ hours of weekly reconciliation.
Explore Stack UnificationAdd point solutions only when your core platform demonstrably cannot meet a specific, measurable need — and only when the integration cost is justified by the capability gap. The integration-first selection criteria should govern every point solution decision: if a tool does not offer a native or well-documented API integration with your hub platform, the operational overhead of maintaining a custom connection will erode the tool's value within 12-18 months.
The sequence matters as much as the selection. After your core platform is operational (typically weeks 8-12 of implementation), add spoke tools in this order of priority:
First priority (months 3-4): Analytics and attribution tools that your core platform cannot provide natively. If your hub is HubSpot, you may need a dedicated web analytics layer (GA4) or a business intelligence tool (Looker, Tableau) for cross-platform reporting. These are high-value, low-integration-risk additions because they primarily consume data rather than write it back.
Second priority (months 4-6): Specialist engagement tools that address specific channel requirements — ABM platforms for account-based campaigns, conversational marketing tools for real-time engagement, or advanced email deliverability tools. Evaluate whether your core platform's native capabilities (e.g., HubSpot's ABM tools) are sufficient before adding a specialist.
Third priority (months 6-9): AI and automation tools that extend your core platform's native capabilities. Content generation, predictive scoring, and workflow automation tools fall here. For a detailed guide on selecting and implementing AI marketing tools, see our AI marketing automation guide.
Fourth priority (months 9-12): Optimisation and testing tools — A/B testing platforms, personalisation engines, and advanced segmentation tools. These deliver value only after your data foundation is clean and your core workflows are stable. Adding them earlier creates noise rather than signal.
Tool Sprawl Warning
Every point solution you add creates ongoing maintenance obligations: API monitoring, field mapping updates, user provisioning, security reviews, and vendor management. A tool that takes 2 hours to install takes 2-4 hours per month to maintain properly. Before approving any new tool, calculate the 12-month maintenance cost — not just the licence fee. Mid-market organisations that skip this calculation end up with 30-40% redundant spending within 2-3 years.
Building reliable integrations requires choosing the right connection method for each tool pair, implementing error handling from day one, and monitoring data flows continuously rather than waiting for failures to surface. The 35-40% integration failure rate in poorly planned stacks is almost entirely preventable with proper architecture and monitoring.
Three integration methods serve B2B martech stacks, each with distinct reliability and maintenance profiles:
Native integrations are built and maintained by the tool vendors themselves. HubSpot's native Salesforce connector, for example, handles bidirectional sync of contacts, companies, deals, and custom objects with built-in conflict resolution and error logging. Native integrations are the most reliable option (99%+ uptime when properly configured) and should be your first choice whenever available. They require no custom code, no middleware licence, and no ongoing developer maintenance.
iPaaS (integration platform as a service) tools like Zapier, Make, or Workato provide pre-built connectors and visual workflow builders for tools that lack native integrations. iPaaS is ideal for moderate-complexity integrations — syncing form submissions to a CRM, triggering email sequences from product events, or pushing analytics data to a dashboard. Reliability depends on the iPaaS vendor's connector quality: enterprise-grade platforms (Workato, Tray.io) achieve 99.5%+ uptime; consumer-grade tools (Zapier) are adequate for non-critical workflows but lack the error handling and monitoring needed for revenue-critical data flows.
Custom API integrations are purpose-built connections using vendor APIs. They offer maximum flexibility but require developer resources to build and maintain. Reserve custom integrations for business-critical data flows that neither native nor iPaaS options can handle — complex data transformations, real-time event streaming, or multi-step workflows with branching logic. Budget 40-80 hours for initial development and 4-8 hours monthly for maintenance per custom integration.
| Method | Reliability | Setup Time | Monthly Maintenance | Best For |
|---|---|---|---|---|
| Native | 99%+ uptime | 1-4 hours | Near zero | Core hub-to-spoke connections |
| iPaaS | 95-99.5% uptime | 4-16 hours | 2-4 hours | Moderate complexity, non-critical flows |
| Custom API | Variable (depends on build quality) | 40-80 hours | 4-8 hours | Complex transformations, real-time events |
Regardless of method, implement these three safeguards from day one. First, error alerting: configure notifications for sync failures, field mapping errors, and data validation exceptions so your team learns about problems before users do. Second, data validation rules: define required fields, format constraints, and deduplication logic at the integration layer rather than relying on downstream tools to catch errors. Third, sync logging: maintain an audit trail of every record created, updated, or deleted by each integration — this is essential for GDPR compliance and invaluable for debugging when data discrepancies appear in your marketing dashboards.
Stack governance is the framework of policies, processes, and ownership structures that prevents your carefully built martech stack from degrading into the same fragmented mess you started with. Without formal governance, tool sprawl returns within 12-18 months as individual team members adopt point solutions outside the approved architecture. Research shows that formal governance reduces tool sprawl by 45-50% over two years compared to ad hoc management.
Effective governance has four components:
Tool approval process. Every new tool request follows a standard evaluation path: business case with measurable outcomes, integration feasibility assessment, TCO calculation (including 12-month maintenance costs), security and GDPR review, and approval from the marketing operations lead. This process does not need to be bureaucratic — a simple request form and 48-hour review cycle prevents 80% of impulse tool purchases without slowing down legitimate needs.
Ownership assignment. Every tool in your stack has a named owner responsible for configuration, user management, integration health, and utilisation monitoring. When tools lack clear ownership, configuration drifts, users create workarounds, and nobody notices when integrations break. The owner does not need to be a full-time administrator — but they must have explicit accountability.
Quarterly review cadence. Run a lightweight audit every quarter: check utilisation scores, review integration health, compare actual usage against the business case that justified each tool, and identify consolidation opportunities. This 2-4 hour quarterly investment prevents the accumulation of technical debt that forces expensive annual overhauls. For a framework on structuring these reviews, see our marketing operations guide.
Documentation standards. Maintain a living stack map that documents every tool, its integrations, data flows, and owner. When team members leave, this documentation prevents knowledge loss. When new tools are evaluated, the stack map reveals integration requirements and potential overlaps immediately.
With Governance
Tool count stays stable or decreases over time. Integration health is monitored proactively. New tools are evaluated against architecture standards. Utilisation stays above 60% across the stack. Annual spending remains predictable and justified.
Result: 45-50% less sprawl over 2 years
Without Governance
Tool count grows 15-25% annually through shadow IT. Integrations break silently and go undetected for weeks. Redundant tools accumulate as teams solve the same problem with different solutions. 30-40% of spending becomes redundant.
Result: Full rebuild needed within 2-3 years
Measuring stack effectiveness requires tracking both operational metrics (is the stack functioning correctly?) and business outcome metrics (is the stack driving measurable results?). Most teams track only one category, leaving blind spots that allow problems to compound undetected. Build a measurement framework that covers both dimensions and review it monthly as part of your marketing dashboard and KPI framework.
Operational metrics tell you whether the stack is healthy:
Integration uptime. Target 99%+ for native integrations, 97%+ for iPaaS connections. Track sync failures per week and mean time to resolution. A well-governed stack should experience fewer than 2 integration incidents per month across all connections.
Data quality score. Measure completeness (% of records with all required fields populated), accuracy (% of records matching validation rules), and deduplication rate (% of unique records vs total). Target 90%+ across all three dimensions. Poor data quality is the number one reason stacks underperform — tools cannot produce good outputs from bad inputs.
Feature utilisation rate. Track what percentage of purchased features your team actively uses. Below 50% utilisation signals over-purchasing or under-training. Marketing Mary's stack unification approach specifically addresses this by connecting your existing tools rather than adding new ones — maximising the value of what you already own.
Business outcome metrics tell you whether the stack drives results:
Lead routing accuracy. Measure the percentage of leads that reach the correct sales rep within the target SLA (typically 5-15 minutes for inbound leads). Well-integrated stacks achieve 90%+ routing accuracy; poorly integrated stacks average 38-55%. Every misrouted lead is a potential deal lost to response time delay.
Campaign cycle time. Track the elapsed time from campaign concept to launch. A well-functioning stack should enable campaign launches within 2-5 business days for standard campaigns. If your team takes 2-3 weeks because of manual data preparation, tool switching, and approval bottlenecks, your stack is creating friction rather than eliminating it.
Labour cost reduction. Measure the hours freed by eliminating manual data transfers and reconciliation. Consolidation typically frees 15-25% of marketing operations resources — equivalent to 6-10 hours per week for a mid-market ops team. Track this monthly to demonstrate ROI and justify continued investment in stack optimisation. Marketing technology typically consumes 2-4% of total marketing budget; if your operations staff spend more than 25% of their time on tool management, your stack is consuming rather than creating value.
Mid-market B2B organisations (100-500 employees) typically allocate £50,000-£150,000 annually to marketing technology, representing 2-4% of total marketing budget. Platform costs account for 55-65% of this expenditure, with implementation services consuming 20-30%. The critical figure is total cost of ownership, not licence fees alone — TCO typically runs 1.5-2x visible licence costs when you include integration development, maintenance, training, and the staff time required to manage each tool.
A complete martech stack build takes 6-12 months from audit to full operational maturity. Core platform implementation takes 8-12 weeks for HubSpot or 12-20 weeks for Salesforce. Point solution integration adds 2-4 months. Governance framework establishment requires another 1-2 months. The most common mistake is rushing the timeline — teams that compress the build into 3-4 months typically spend 6+ months afterwards fixing integration issues and retraining users on processes that were poorly documented during the rush.
HubSpot suits B2B teams with 100-300 employees that want an all-in-one platform with strong native marketing automation, CMS, and CRM in a single interface. Implementation is faster (8-12 weeks) and ongoing administration is lighter. Salesforce suits larger teams (300-500+) with complex sales processes, custom object requirements, and enterprise-grade reporting needs. Implementation takes 12-20 weeks and requires more technical administration. Both platforms have strong UK presence and GDPR compliance capabilities. Evaluate based on your specific data model complexity and team technical capacity rather than brand reputation.
The biggest mistake is buying tools before defining the architecture. When teams select tools based on feature lists, demos, and peer recommendations without first determining how those tools will connect, what data they will share, and who will maintain the integrations, they end up with a collection of individually excellent tools that collectively underperform. The 35-40% integration failure rate in poorly planned stacks is almost entirely caused by this tools-first, architecture-later approach. Always audit, architect, then select.
GDPR compliance in a multi-tool stack requires three capabilities: centralised consent management (one system of record for consent status that syncs to all tools), data subject access request workflows (ability to locate and export all personal data across every platform within 30 days), and data residency controls (ensuring personal data stays within approved jurisdictions). 73% of UK marketing ops managers cite GDPR as their primary vendor evaluation factor. The hub-and-spoke architecture simplifies compliance because consent status flows from the hub to all spokes via a single integration point rather than requiring tool-by-tool consent management.
Consolidate when your audit reveals three or more of these signals: feature utilisation below 50% on multiple tools, more than 3 manual data transfer processes between tools, integration maintenance consuming more than 10 hours per month, redundant capabilities across two or more platforms, or total tool count exceeding 15 with no governance framework. Consolidation delivers 30-40% cumulative savings over 2-3 years and frees 15-25% of marketing operations resources currently spent on tool management rather than strategy.
Join 500+ Marketing Leaders Already on the Waitlist
Be first to experience the AI marketing co-pilot that unifies your stack, creates content at scale, and lets you talk directly to your buyer personas.
Clwyd Probert
Founder, Marketing Mary
Clwyd Probert is the founder of Marketing Mary, an AI-powered marketing co-pilot platform, and CEO of Whitehat, a London-based SEO and inbound marketing agency and HubSpot Platinum Partner since 2016.
Sources: Chiefmartec MarTech Landscape 2024, Gartner Marketing Technology Survey, Forrester B2B Marketing Benchmarks 2025

The Marketing Co-Pilot Operating Model is a three-stage framework for running AI-assisted marketing: Scan (research, listening and persona intake),...

How to Run a MarTech Stack Audit: Framework, Scoring Template, and ROI Calculator A MarTech stack audit systematically evaluates every marketing...

A buyer persona tool is software that builds, stores, and operationalises research-based profiles of your ideal customers — the goals, pains, and...
1 min read
How to Run a MarTech Stack Audit: Framework, Scoring Template, and ROI Calculator A MarTech stack audit systematically evaluates every marketing...
1 min read
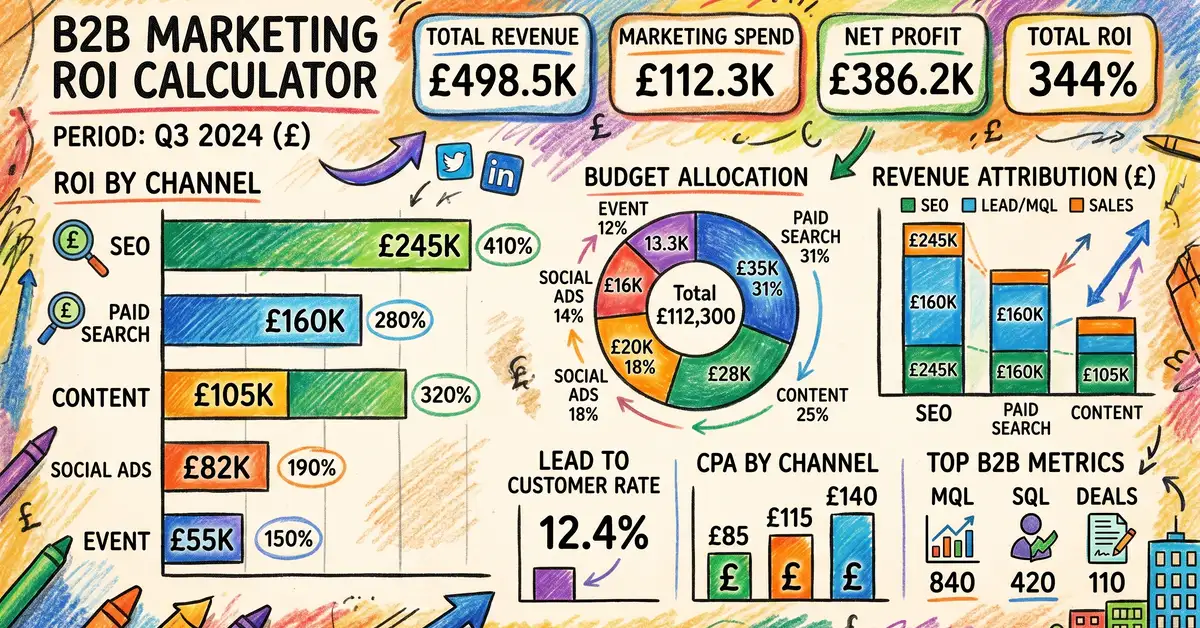
A marketing ROI calculator takes your channel spend, revenue generated, and associated costs — then outputs the true return percentage, cost per...

1 min read
Key Takeaway The AI marketing tool market has exploded to 15,384 solutions, yet most UK SME teams need just 3–5 well-chosen tools — not twelve. The...